Fundamental Analysis : All the Secrets and Best Tips

Studies have shown that investors who incorporate fundamental analysis into their strategies are twice as likely to achieve consistent and profitable results in the financial markets.
Our mission is clear: to unveil the secrets and best tips that support the art of fundamental analysis and, in doing so, empower you to make informed and successful investment decisions.
(We may earn a commission if you make a purchase through these links. Please rest assured that this comes at no additional cost to you. We only recommend products and services that we genuinely believe will provide value to our readers. Your trust and satisfaction are of utmost importance to us.)
Understanding Fundamental Analysis
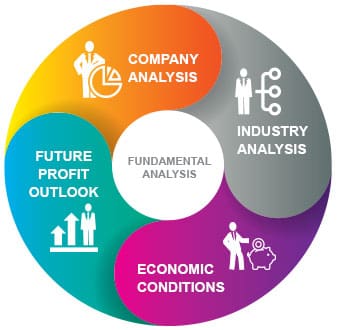
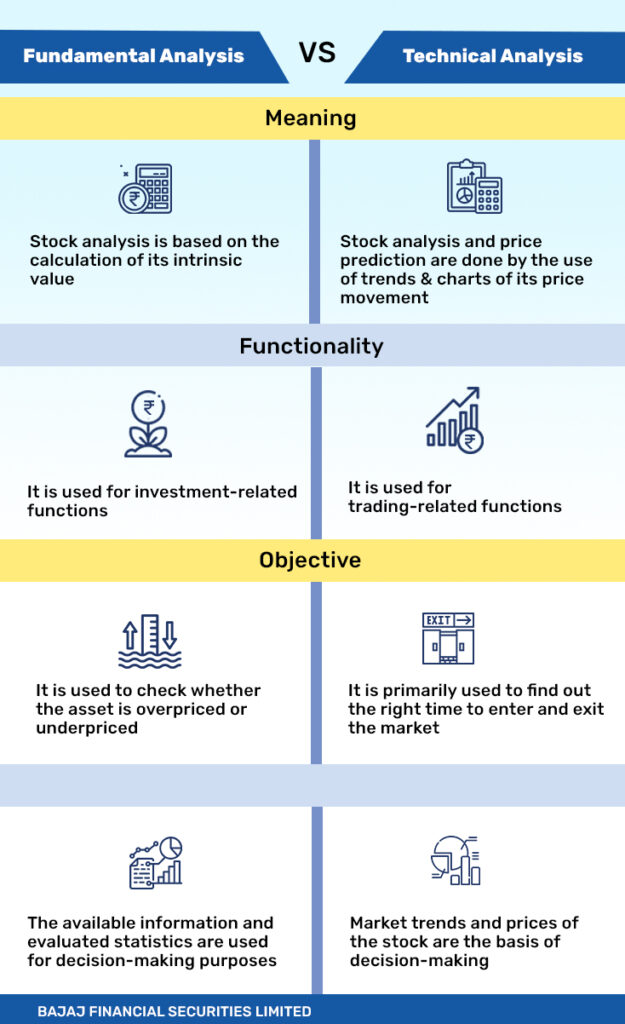
Fundamental analysis is a method used by investors to evaluate the financial health and performance of a company or asset.
It involves analyzing a variety of financial data, including income statements, balance sheets, cash flow statements, and key ratios, to measure the intrinsic value of an asset.
The core principle is to determine whether an asset is overvalued or undervalued in the market.
Significance in Investment Decision-Making
Fundamental analysis provide a deep understanding of a company’s financial standing, growth prospects, and overall health. By examining the intrinsic value, we can identify opportunities for long-term growth and make rational choices in allocating our capital.
This type of analysis also helps us to uncover potential red flags and weaknesses within an asset or a company.
Historical Context and Evolution
The origin of fundamental analysis trace back to the early 20th century when Benjamin Graham and David Dodd introduced it in their revolutionary book “Security Analysis” in 1934. This marked a shift from speculative investing to a more rational and data-driven approach.
Over the years, it has evolved along with advancements in technology and the accessibility of financial data.
Today, is an essential tool for us investors aiming to navigate the complexities of financial markets.
The Building Blocks of Fundamental Analysis
When we are doing a fundamental analysis we absolutely need to take all this factor in consideration and carefully check it and compare it with other same or related companies, in order to do the best fundamental analysis and have the best accurate results.
1. Financial Statements:
- Income Statement : also known as profit and loss statement, it provides a complete view of a company’s revenues, expenses, and net income over a specified period, typically a quarter or a fiscal year. In simple terms, it reveals the company’s ability to generate profits from its core operations, the efficiency of its cost management, and its revenue growth trends.
- Balance Sheet: The balance sheet offers a snapshot of a company’s financial position at a specific point in time. It includes the company’s assets, liabilities , and shareholders’ equity. We check the balance sheet to assess the company’s financial stability, liquidity, and its ability to meet short and long term obligations.
- Cash Flow Statement: This statement tracks the inflow and outflow of cash in various categories: operating activities (cash generated from core operations of the company), investing activities (cash spent on investments like acquisitions or asset purchases), and financing activities (cash from or used for borrowing, issuing stock, or paying dividends to shareholders ). So this statement provide us insights into a company’s cash-generating capabilities and its financial flexibility.
2. Key Financial Ratios:
- Price-to-Earnings (P/E) Ratio: The P/E ratio compares a company’s stock price to its earnings per share (EPS). It’s a metric that help to assess how much we are paying for each dollar of earnings. A high P/E ratio may indicate investor optimism, while a low ratio may suggest undervaluation.
But what is a high or low P/E ratio ?
A “high” or “low” P/E ratio can vary depending on the industry, market conditions, and individual investor perspectives. However, as a general guideline:
The P/E Ratio is considered High when :
- The P/E ratio is higher than the historical average for the particular company or its industry .
- The P/E ratio is significantly above the average P/E ratios of comparable companies in the same industry .
- The P/E ratio is above 25-30 or more, especially in mature or stable industries.
A high P/E ratio can suggest that investors have high expectations for a company’s future growth or that the stock is relatively expensive compared to its current earnings.
The P/E Ratio is considered Low when :
- The P/E ratio is lower than the historical average for the particular company or its industry .
- The P/E ratio is significantly below the average P/E ratios of comparable companies in the same industry .
- The P/E ratio is below 10-15 or less .
A low P/E ratio can indicate that a company’s stock is trading at a discount relative to its current earnings, which might make it appear undervalued to some investors.
- Price-to-Book (P/B) Ratio: The P/B ratio compares a company’s stock price to its book value per share (you take the total assets minus total liabilities and you divide this result by the number of shares outstanding). It helps investors in evaluating whether a stock is trading at a premium or discount to its net asset value.
But what is a good or bad P/B ratio ?
There is no universally fixed threshold for what constitutes a good or bad P/B ratio, but here are some general guidelines:
We can have Low P/B Ratio when :
- It is below 1 and may suggest that the stock is trading at a discount to its book value, which can be seen as favorable by value investors.
- If it is below the historical average for a particular company or industry may also be viewed as positive.
We can have High P/B Ratio when :
- The ratio is significantly above 3, especially in industries where tangible assets are less relevant (such as technology or biotech).
- If it is above 5 or 6 .
- Debt-to-Equity Ratio: This ratio measures a company’s financial leverage by comparing its total debt to shareholders’ equity. A high debt-to-equity ratio (above 2) may indicate greater financial risk, while a low ratio (below 1) suggests a more conservative capital structure and is often viewed positevily because it suggets a lesser dependence on borrowed capital.
- Return on Equity (ROE): ROE measures the company’s ability to generate returns for its shareholders. To calculate it we take the net income and we divided it by the shareholders’ equity. A high ROE (above 15-20%) often indicates efficient use of shareholder capital.
- Current Ratio: The current ratio evaluates a company’s short-term liquidity by comparing current assets to current liabilities. A ratio that is above 1 indicates the company can cover its short-term obligations.
- Quick Ratio (also known as Acid-Test Ratio): It is similar to the current ratio but excludes inventory. It provides a stricter measure of short-term liquidity. ( Remember that a good quick ratio is typically considered to be around 1 or higher )
- Dividend Yield: Dividend yield is the annual dividend per share divided by the stock’s current market price. It’s essential for income-oriented investors seeking dividend-paying stocks. ( To see if the company have a good or bad dividend yield you need to compare it to the industry average or to comparable investments)
- Earnings Before Interest and Taxes (EBIT) Margin: This margin measures a company’s profitability by calculating EBIT as a percentage of total revenue. It reveals the company’s ability to generate profits from its operations before interest and taxes.
- Free Cash Flow (FCF) Yield: FCF yield is calculated by dividing free cash flow by market capitalization. It reflects the cash generated by the company relative to its market value.
- Price-to-Sales (P/S) Ratio: The P/S ratio compares a company’s stock price to its revenue per share. It helps assess the valuation relative to the company’s sales. ( Remember that to se if the P/S ratio is good or not, it should be below the average P/S ratio of comparable companies in the same industry )

3. Qualitative Analysis
Qualitative analysis is a method of evaluation that focuses on understanding and interpreting non-numerical, qualitative information that are related to a company or investment.
Unlike quantitative analysis ( what we have seen before), which relies on numerical data and financial metrics, qualitative analysis focuses on qualitative, often subjective aspects that can influence investment decisions. When we do a qualitative analysis we need to check :
- Management Quality: We need to examine the competence and integrity of the company’s management team, like their track record, decision-making abilities, and corporate governance practices.
But hey, where i can see this ?
It is very simple, you can see the company’s annual reports, or other official documents. You can also check if there are some recent news or press releases that are related to the copmpany.
- Industry Analysis: We examin the industry’s competitive landscape, growth prospects, technological advancements, and regulatory influences that may impact the company’s performance.
- Competitive Advantage: We evaluate the company’s competitive strengths, including its brand recognition (like Coca Cola, Nike), patents (like Microsoft or Google), proprietary technology (like Nvidia or Tesla) , and market positioning relative to competitors.
- Economic and Market Conditions: You need to consider broader economic and market trends, such as interest rates, inflation, and consumer sentiment, that may affect the company’s operations and growth prospects.
- SWOT Analysis: Conduct a Strengths, Weaknesses, Opportunities, and Threats (SWOT) analysis to assess a company’s internal strengths and weaknesses and external opportunities and threats.
- Management’s Strategy: Examine the company’s objectives and how well the management team is executing them. Analyze their long-term vision and the efficacy of their growth plans.
- Corporate Governance: Evaluate the company’s corporate governance practices like the executives’ compensations and if they adhere and have ethical standards.
- Customer Base and Loyalty: Assess the company’s customer base, customer satisfaction levels, and brand loyalty. Understand the company’s ability to retain customers and grow its market share.
Fundamental analysis combines these quantitative and qualitative factors in order to provide investors with a well rounded evaluation of a company’s financial health, intrinsic value, and investment potential.
Avoiding Fundamental Analysis Common Pitfalls
Here are the 10 common mistakes that i hope you will avoid :
- Focusing solely on quantitative data (financial metrics) and ignoring qualitative factors.
- Don’t beeing open to alternative viewpoints and not considering diverse source of information.
- Focusing only on the individual company’s fundamentals without considering the broader industry dynamics and the competitors.
- Ignoring economic and market trends, and don’t understand that there are external factors that can affect the stock prices.
- Not considering the long term prospect of the company.
- Focusing too much on the short term fluctuation.
- Not paying attention to the risks associated with an investment.
- Letting the emetions drive your investment decisions.
- Conducting fundamental analyis once and then failing to update it, as new informations becomes available.
- Having a lack of patience and selling or buying based on short term price movements.
BEST FUNDAMENTAL ANALYSIS BOOKS

If you’re interested in learning more about fundamental analysis, here are my top picks that can provide you with valuable insights and knowledge , and I promise that you will not waste your time :
(We may earn a commission if you make a purchase through these links. Please rest assured that this comes at no additional cost to you. We only recommend products and services that we genuinely believe will provide value to our readers. Your trust and satisfaction are of utmost importance to us.)
- “The Intelligent Investor” by Benjamin Graham
- “Financial Statement Analysis” by Martin S. Fridson and Fernando Alvarez
- “The Little Book of Common Sense Investing” by John C. Bogle
- “Warren Buffett and the Interpretation of Financial Statements” by Mary Buffett and David Clark
- “Quality of Earnings” by Thornton L. O’glove
- “Financial Shenanigans” by Howard M. Schilit
If you are a passionate reader like me check this post for more finacial books to read :
Recent Posts
- Stablecoin vs Fiat Currency : Who Win This Great Debate ?
 In the ongoing debate of Stablecoin vs Fiat, as the global economy transforms, questions arise about the roles these currencies play in shaping our financial future. This exploration dives into the core of the debate, highlighting the differences, benefits, and…
 - IPO Explained : How to Start the Right Way
 IPO explained simply. Ever thought about how companies go from being private to being in the stock market spotlight? It’s through something called an Initial Public Offering, or IPO. It’s like a big debut for companies, with lots of potential…
 - Trading vs Investing : Wich is the Better Solution?
 In the world of money, deciding between trading vs investing is a big deal. It’s like choosing a path that will seriously affect your financial future. Trading and investing are different ways to handle your money, and the choice you…
 - What is the Most Secure Stablecoin of 2023 ?
 We’ll take a deep dive into the world of stablecoins, exploring their types, evaluating criteria for security, and identifying the most secure stablecoin. The cryptocurrency market is in constant evolution and with new players entering the scene, security has become…
 - Penny Stocks vs Crypto : What is the Best Solution ?
 In this exploration of Penny Stocks vs. Crypto, we will delve into the heart of these investment choices. Penny Stocks and Cryptocurrencies, each of these asset classes carries its own unique set of promises and perils, offering the potential for…