Balance Sheet: Made Easy, Became the Best Stock Analyzer
The balance sheet one of the well guarded secret, that has permitted many times to increase the wealth of the people who master it.
Take,for instance, the year 2021, despite the economic turmoil caused by the pandemic, the world’s top 10 billionaires collectively saw their wealth increase by an astonishing $540 billion!
This rise wasn’t a result of chance or luck but a testament to the power of understanding and utilizing the insights hidden within balance sheets.
In this guide, we’re about to empower you to make informed investment decisions, just like the billionaire elite. But before we dive into the intricacies of balance sheet analysis, let’s understand and start from the basis.
(This website contains affiliate links, which means we may earn a commission if you choose to make a purchase through our links. This comes at no additional cost to you. We only recommend products and services that we believe will provide value to our users. Your support through these links helps us maintain and improve our website and the content we provide. Thank you for your support!)
What is a Balance Sheet?
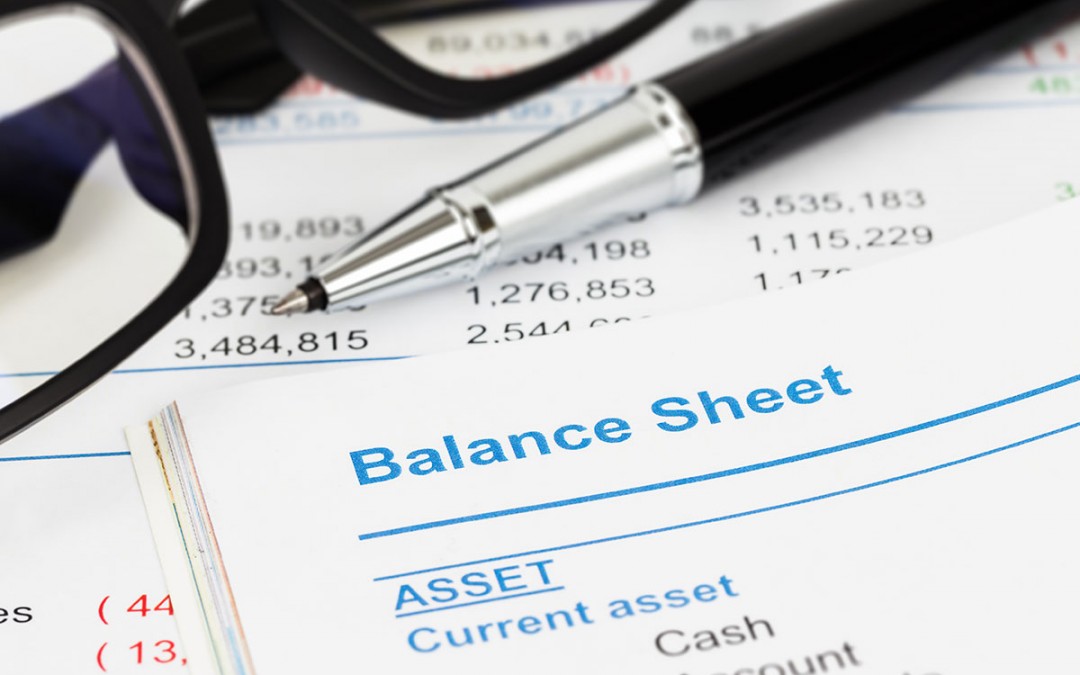
So, we can say that the balance sheet is like a financial snapshot of a company at a specific moment in time, usually at the end of a quarter or year.
It’s a document that shows what a company owns (its assets), what it owes (its liabilities), and what’s left over for the company’s owners (the shareholders’ equity). In simple terms, it’s like a list of everything a company has and owes, providing a clear picture of its financial health.
Why is a Balance Sheet Significant in Stock Analysis?
Knowing how to read the balance sheet is crucial for anyone looking to invest in stocks, because it reveals vital information about a company’s financial stability and strength. Here’s why it’s so important for stock analysis and also stock picking:
- A balance sheet helps investors evaluate if a company is financially healthy.
- It provides insights into the company’s net worth. By subtracting liabilities from assets, you can find the company’s book value. This is valuable for estimating the intrinsic value of its shares. ( liabilities – assets= book value )
- Over time, you can track changes in a company’s balance sheet to spot trends. Are assets growing? Are debts increasing? and so on…
- Investors often compare the balance sheets of different companies in the same industry to see which one is financially stronger.
- A balance sheet can also reveal hidden risks, such as excessive debt or declining assets.
Why You Need to Master Balance Sheet Analysis ?
Becoming expert in balance sheet analysis will provide you with a multitude of benefits. Let’s explore these advantages :
1. Informed Decision-Making: Proficiency in balance sheet analysis allows investors to make well-informed decisions. You will make choices based on concrete data.
2. Risk Mitigation: You can identify and mitigate potential risks by scrutinizing balance sheets.
3. Identifying Opportunities: Good analysis enables you to identify hidden opportunities.
4. Valuation Accuracy: You can more accurately value companies by considering their balance sheets, preventing the overvaluation or undervaluation of assets.
5. Long-Term Perspective: Balance sheet analysis supports a long-term investment strategy. So you can see if a company has the financial stability to continue generating profits over the years.
6. Portfolio Diversification: Mastering the balance sheet will aid you, in creating a diversified investment portfolio. For example, some investors can balance their investments between financially stable companies and those with growth potential.
7. Improved Timing: By monitoring balance sheets, you can time your entry or exit from the market more effectively. For instance, you may choose to buy stocks of a financially stable company during market downturns when prices are lower.
List of the Top Investors that Use the Balance Sheet
Several investors have demonstrated how expertise in balance sheet analysis can lead to financial success, like :
- Warren Buffett
- Benjamin Graham
- Peter Lynch
- Charlie Munger
- Carl Icahn
- Ray Dalio
- George Soros
- Joel Greenblatt
I hope that now you understand how useful and important it is to know how to use this tool correctly. With practice, time, and consistency, you will see that you, too, can use it like they do. And who knows, one day, you could be on this list.
The Key Components of a Balance Sheet
Let’s break down the balance sheet into its essential components and provide explanations along with examples to help you understand how to use them effectively:
- Assets: They are everything a company owns that has value and can be used to generate future income. They are typically categorized into two main types, current assets and non-current (or long-term) assets.
Some examples of current assets are:
- Cash
- Accounts Receivable
- Inventory
- Prepaid Expenses
Some examples of non-current assets are:
- Property, Plant, and Equipment
- Intangible Assets
- Investments
2. Liabilities: They represent the company’s obligations or debts that it needs to pay in the future.
Some examples of current liabilities are:
- Accounts Payable
- Short-Term Loans
- Accrued Liabilities
Some examples of non-current liabilities are:
- Long-Term Debt
- Deferred Tax Liabilities
- Pension Obligations
3. Shareholders’ Equity: Represents the owners’ claim on the company’s assets after deducting liabilities. It’s also known as “net assets” or “book value”.
In this section of the balance sheet we have :
- Common Stocks
- Retained Earnings
- Additional Paid-In Capital
Understanding these balance sheet components, will allow you to make informed decisions about a company’s financial strength, risk, and potential for growth.
Common Pitfalls to Avoid
Here is a list of the commmon mistakes that beginners make, when analyzing balance sheets :
- Ignoring the Footnotes
- Focusing Only on Current Ratios
- Not Comparing with Industry Benchmarks
- Ignoring Off-Balance Sheet Items
- Overlooking Non-Current Assets
- Not Analyzing Trends
So, How can I avoid these pitfalls and make informed investment decisions?
- Always read the footnotes accompanying the balance sheet. This is where you’ll find explanations for accounting methods, potential risks, and contingencies.
- Consider other liquidity and solvency ratios, to gain a more comprehensive view of the company’s financial stability.
- Use industry benchmarks to understand how a company’s balance sheet measures up against its competitors.
- Research and include off-balance sheet items in your analysis.
- Pay attention to non-current assets, as they can represent significant value for the company and they can impact the company’s long-term growth prospects.
- Compare balance sheets from different periods to identify trends. Look for patterns in assets, liabilities, and shareholders’ equity to determine whether the company is improving or not at all.
Key Formulas for Analyzing Balance Sheets
Here’s a list of formulas commonly used when analyzing a balance sheet :
- Book Value:
- Formula: Shareholders’ Equity = Total Assets – Total Liabilities
- Use: Measures the net worth of a company, showing what’s left for shareholders after settling all debts and selling assets.
- Current Ratio:
- Formula: Current Assets / Current Liabilities
- Use: Assesses a company’s short-term liquidity and its ability to cover immediate financial obligations.
- A current ratio above 1.5 is generally considered healthy.
- A current ratio significantly below 1 may suggest liquidity issues, so read flag.
- Quick Ratio (Acid-Test Ratio):
- Formula: (Current Assets – Inventory) / Current Liabilities
- Use: Provides a more stricter measure of short-term liquidity without counting inventory.
- A quick ratio of 1 or higher is typically considered healthy.
- A quick ratio significantly below 1 may indicate a potential liquidity problem, so read flag.
- Debt-to-Equity Ratio:
- Formula: Total Debt / Shareholders’ Equity
- Use: Measures a company’s financial leverage, so evaluates how much a company depends on debt for financing.
- A lower debt-to-equity ratio is generally preferred
- A high debt-to-equity ratio, especially well above 1, may be a concern.
- Debt Ratio:
- Formula: Total Debt / Total Assets
- Use: Evaluates the proportion of a company’s assets financed by debt.
- Return on Equity (ROE):
- Formula: Net Income / Shareholders’ Equity
- Use: Indicates the company’s profitability in relation to shareholders’ equity. So in simple terms, shows how profitable the company is relative to its shareholder investment.
- A higher ROE is generally better. ROEs in the range of 15% or higher are often considered good.
- A consistently low or negative ROE it is a red flag.
- Asset Turnover Ratio:
- Formula: Revenue (Sales) / Total Assets
- Use: Measures how efficiently a company utilizes its assets to generate revenue.
- A higher asset turnover ratio indicates efficient asset utilization. The ideal ratio varies by industry, but generally, higher is better.
- A consistently low or declining asset turnover ratio it is a red flag.
- Working Capital:
- Formula: Current Assets – Current Liabilities
- Use: Represents the company’s short-term operational liquidity. So you will discover, if the company in the near term has the ability to cover day-to-day expenses.
- Positive working capital is generally considered healthy.
- Negative working capital, may signal liquidity issues and difficulties covering short-term obligations.
- Inventory Turnover Ratio:
- Formula: Cost of Goods Sold / Average Inventory
- Use: Evaluates how effectively a company manages its inventory.
- The higher the better.
- A low or decreasing inventory turnover ratio, may suggest excess or obsolete inventory.
- Accounts Receivable Turnover Ratio:
- Formula: Net Sales / Average Accounts Receivable
- Use: Measures how quickly a company collects payments from customers.
- The higher the better.
- A low or decreasing accounts receivable turnover ratio is a red flag.
- Gross Margin Percentage:
- Formula: (Gross Profit / Revenue) * 100
- Use: Indicates the percentage of revenue retained as profit after covering the cost of goods sold.
- We wont to see this number increasing over time.
- A declining gross margin percentage is a red flag.
- Net Margin Percentage:
- Formula: (Net Income / Revenue) * 100
- Use: Shows the percentage of revenue that remains as profit after all expenses, including taxes and interest.
- The higher the better.
- A consistently low or negative net margin percentage may suggest financial inefficiency
- Return on Assets (ROA):
- Formula: Net Income / Total Assets
- Use: Measures how effectively a company generates profit relative to its total assets.
- ROAs above 5% are often considered healthy.
- A consistently low or negative ROA, may suggest inefficiency in utilizing assets to generate profits.
- Equity Multiplier:
- Formula: Total Assets / Shareholders’ Equity
- Use: Evaluates the relationship between a company’s assets and shareholders’ equity.
- The lower the better.
- A significantly high equity multiplier may indicate high leverage and increased financial risk.
I hope you find this list useful.
Reading the Balance Sheet Like a Pro

Here’s a step-by-step guide to help you reading this financial document with less head pain and with confidence:
Step 1: You need to look at the balance sheet’s title, date, and the currency it’s presented in. Your goal in this step is to ensure that the informations are current and relevant to your analysis.
Step 2: You need to make sure, that the balance sheet you are analyzing, follows the standard accounting equation: Assets = Liabilities + Shareholders’ Equity. This equation should always balance.
Step 3: Familiarize yourself with the balance sheet’s structure in front of you. Typically you will have the list of assets on the left side and liabilities and shareholders’ equity on the right side.
Step 4: You analyze current vs. non-current assets and liabilities
Step 5: Calculate key ratios
Step 6: Assess asset quality by examining their composition.
Step 7: Look at the nature of liabilities. See for example, if there are significant long-term debts.
Step 8: Analyze the components of shareholders’ equity. For example, you check if the company is retaining earnings or distributing them as dividends
Step 9: Compare the current balance sheet to previous periods. Your goal here, is to identify trends. You can see if assets are growing, or if the liabilities are decreasing.
Step 10: Compare the company’s balance sheet to industry benchmarks.
Step 11: Look if there is presence of red flags.
Final Thoughts
I really hope that you have found the information you were looking for. My main goal is to make things easy and clear for you, and that once you finish reading this post, you have learned something. And if, like me , you’re a reader , here you will find my top books to read about this topic.
(This website contains affiliate links, which means we may earn a commission if you choose to make a purchase through our links. This comes at no additional cost to you. We only recommend products and services that we believe will provide value to our users. Your support through these links helps us maintain and improve our website and the content we provide. Thank you for your support!)
- “The Interpretation of Financial Statements“ by Benjamin Graham and Spencer B. Meredith
- “Financial Statement Analysis and Security Valuation“ by Stephen H. Penman
- “Warren Buffett and the Interpretation of Financial Statements“ by Mary Buffett and David Clark
- “How to Read a Financial Report“ by John A. Tracy
- “Financial Shenanigans: How to Detect Accounting Gimmicks & Fraud in Financial Reports“ by Howard M. Schilit
- “Financial Analysis and Modeling Using Excel and VBA” by Chandan Sengupta
If you want to know which other finance books to read, check out this post:
Recent Posts
- Stablecoin vs Fiat Currency : Who Win This Great Debate ?
 In the ongoing debate of Stablecoin vs Fiat, as the global economy transforms, questions arise about the roles these currencies play in shaping our financial future. This exploration dives into the core of the debate, highlighting the differences, benefits, and…
 - IPO Explained : How to Start the Right Way
 IPO explained simply. Ever thought about how companies go from being private to being in the stock market spotlight? It’s through something called an Initial Public Offering, or IPO. It’s like a big debut for companies, with lots of potential…
 - Trading vs Investing : Wich is the Better Solution?
 In the world of money, deciding between trading vs investing is a big deal. It’s like choosing a path that will seriously affect your financial future. Trading and investing are different ways to handle your money, and the choice you…
 - What is the Most Secure Stablecoin of 2023 ?
 We’ll take a deep dive into the world of stablecoins, exploring their types, evaluating criteria for security, and identifying the most secure stablecoin. The cryptocurrency market is in constant evolution and with new players entering the scene, security has become…
 - Penny Stocks vs Crypto : What is the Best Solution ?
 In this exploration of Penny Stocks vs. Crypto, we will delve into the heart of these investment choices. Penny Stocks and Cryptocurrencies, each of these asset classes carries its own unique set of promises and perils, offering the potential for…